Results
Optimization History For Response "F"
The Optimization History is a good tool to monitor the progress of our optimization. The view will be updated continuously after each iteration while the optimization is running.
Start the LS-OPT Viewer (Select the Viewer panel in the LS-OPT GUI) and
- Select History under subtitle "Optimization".
- A new window will appear, then select under "Setup" tab Response → F.
→ We can see, that with 3 iterations
there is still no convergence.
→ At the 6'th iteration we can see
that the response is getting close
to the optimal point.
→ After 10 iterations a good 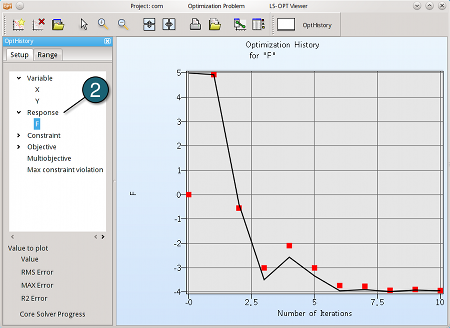
convergence can be observed.
We can conclude that perhaps
less than 10 iterations would
have sufficed to find the optimum.