DynaStats
Statistics of the LS-DYNA results evaluated from d3plot files can be visualized in LS-PrePost using DynaStats. The statistical results are fringed on a selected Finite Element model.
Open DynaStats
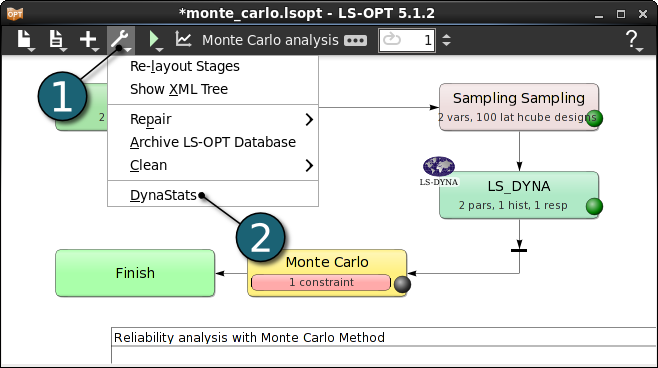
- Click on the Tools menu of the control bar.
- Click on the DynaStats.
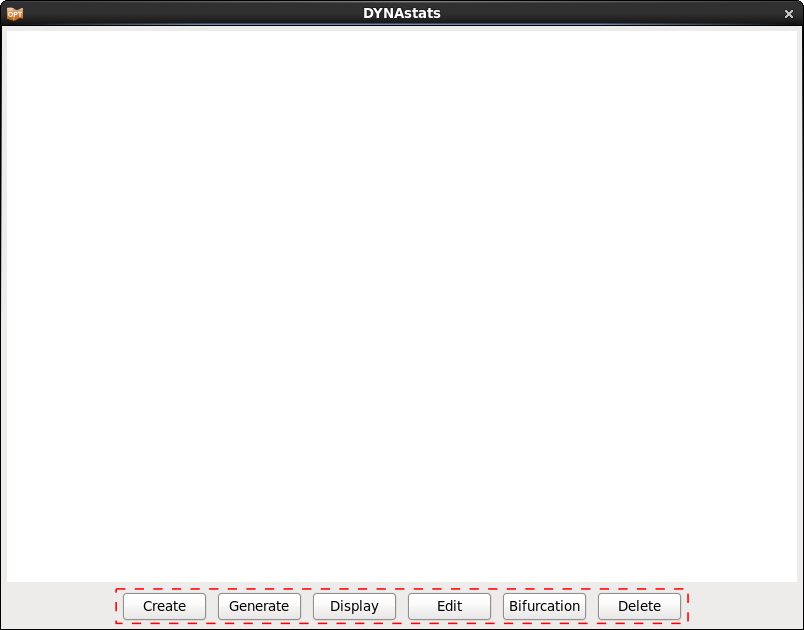
A new DynaStats dialog shall open and utilize the following actions:
- Create
- Generate
- Display
- Edit
- Bifurcation
- Delete
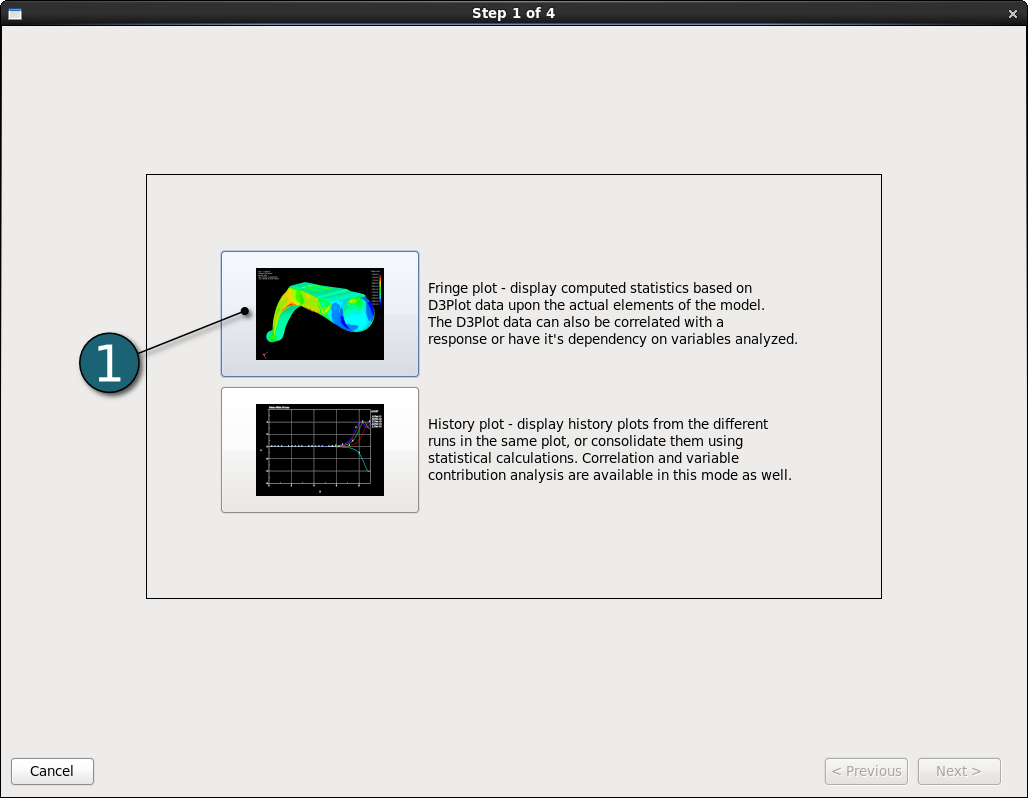
Create Fringe Plot
- Select Fringe plot option after clicking on the Create button in the main DynaStats dialog.
Display the Statistics in LS-PrePost (D3Plot) - Mean
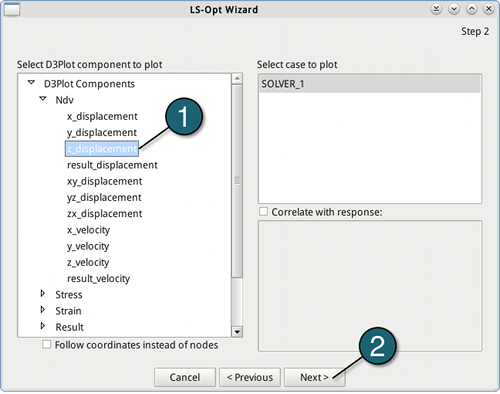
- Select z_displacement from the list Ndv (Nodal displacement velocity).
- Go to the Next panel.
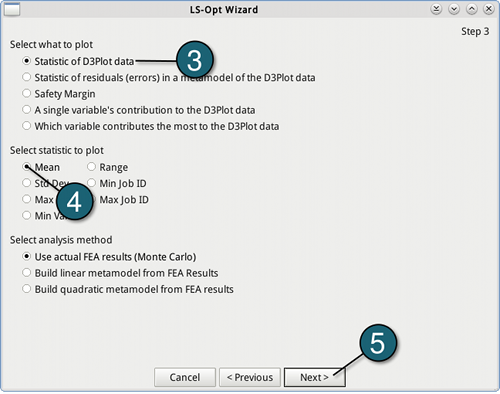
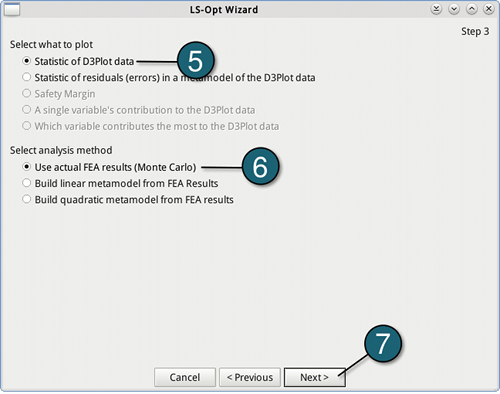
- For what to plot select Statistic of D3Plot data.
- Choose Mean as statistic to plot.
- Go to the Next panel.
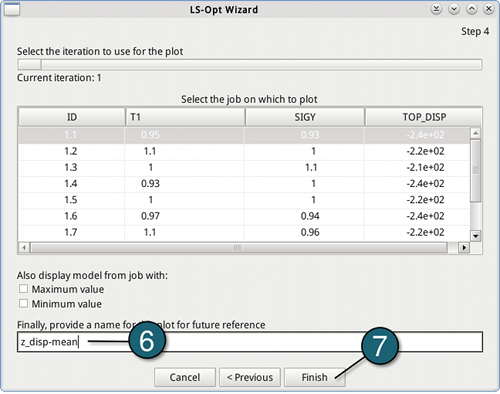
- Give a name to this plot, e.g. z_disp-mean.
- Push the Finish button.
- Select the new created plot z_disp-mean in the DynaStats dialog and then click on the Generate option to generate the data for the plot.
- Display the previously generated plot in LS-PrePost.
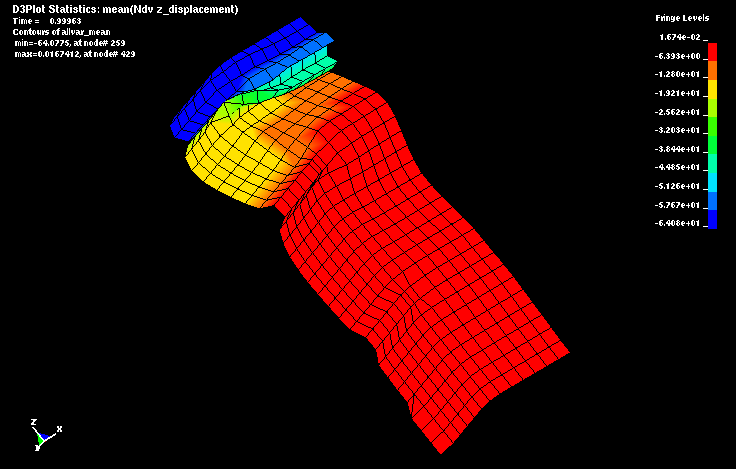
The figure shows the mean of the z-displacement at time 0.99963s.
→ The minimum occurs at node 259 (min=-64.0775) and the maximum at node 429 (max=0.0167412).
Display the Statistics in LS-PrePost (D3Plot) - Standard deviation
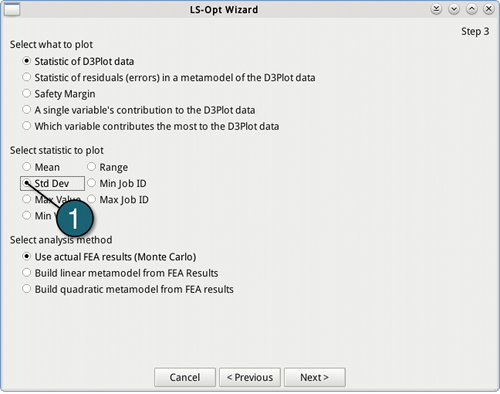
- It follows the way explained above, except:
- In the second step, choose Std Dev (Standard deviation) as statistic to plot.
- In the last step, give a name to this plot, e.g. z_disp-std_dev.
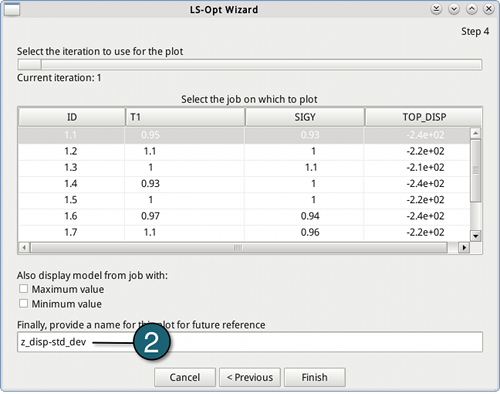
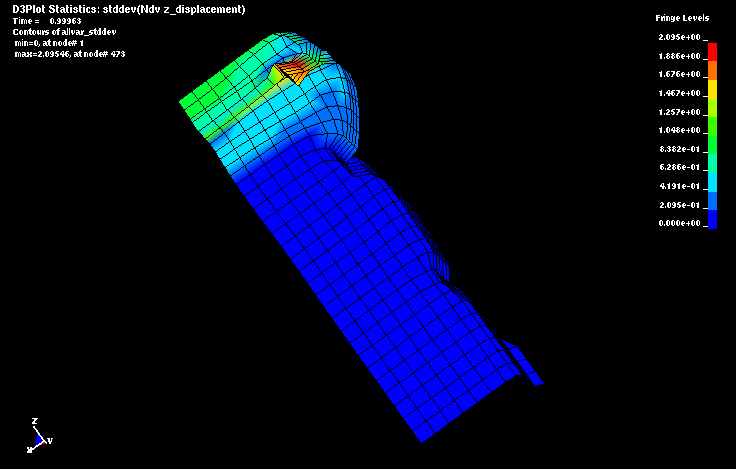
The figure shows the standard deviation of the z-displacement at time 0.99963s.
→ The maximum occurs at node 473 (max = 2.09546) where the deformation is large.
Display the Statistics in LS-PrePost (D3Plot) - Correlation
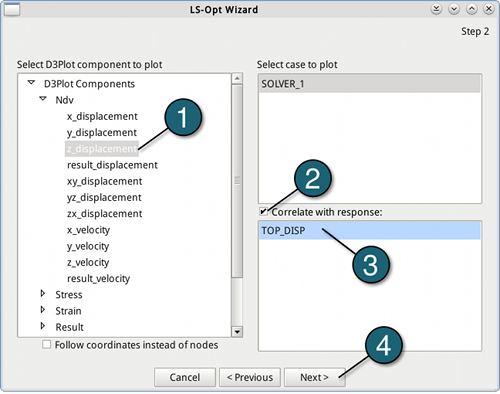
- Select z_displacement from the list Ndv (Nodal displacement velocity).
- Check the Correlation with response check box.
- Choose the response TOP_DISP.
- Go to the Next panel.
- For what to plot select Statistic of D3Plot data.
- For analysis method, choose Use actual FEA results.
- Go to the Next panel.
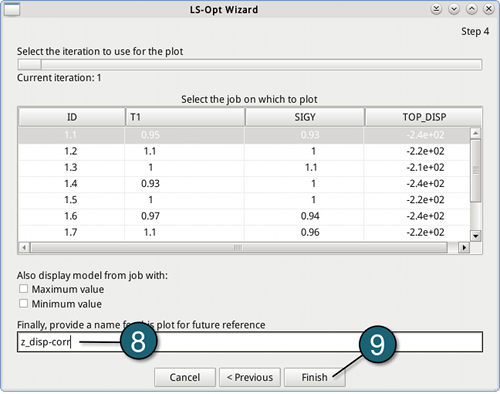
- Give a name to this plot, e.g. z_disp-corr.
- Push the Finish button.
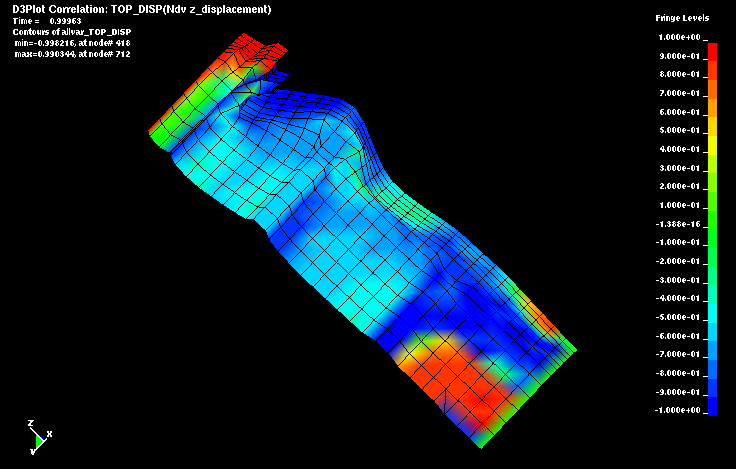
The figure shows the correlation of the z-displacement with the response TOP_DISP at time 0.99963s.
→ The red areas illustrate positive correlation (positive changes in the response are associated with positive changes in the displacement), the dark blue areas display negative correlation (positive changes in the response are associated withe negative changes in the displacement or vice versa). Furthermore green areas mark no correlation.
