Sensitivities
Which variable appears to be the most important?
The significance of a variable for a response can be illustrated with ANOVA (analysis of variance) or GSA/Sobol (global sensitivity analysis), e.g for the response/objective acceleration you may find:
New Plot
- To view a new plot select the plot button on the task bar. A seperate window of LS-OPT Viewer opens up.
LS-OPT Viewer
ANOVA
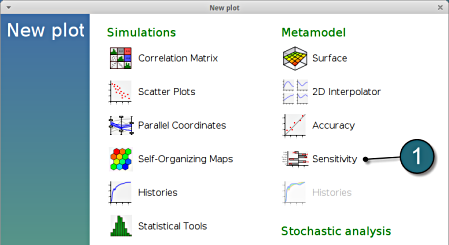
- Restart the LS-OPT Viewer and select under Metamodel the item Sensitivity
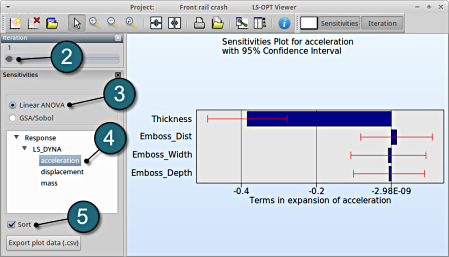
- We can slide to observe the sensitivity of results at each iteration. In this case for Iteration 1.
- Select Linear ANOVA in the new window.
- From Response select acceleration.
- Sort the variables according to their significance.
→ For the response acceleration the variable thickness is the most important, while the other variables are rather insignificant.
GSA/Sobol
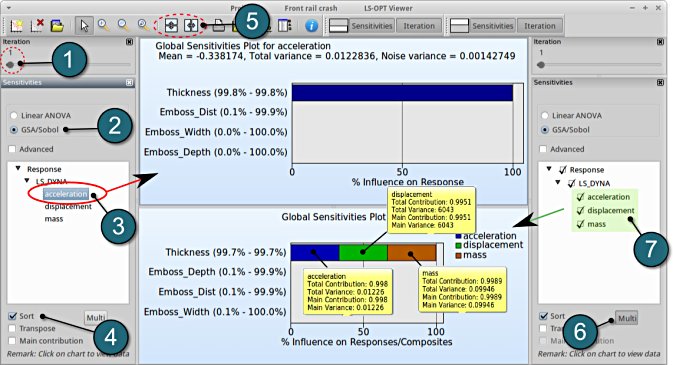
- We can slide to observe the sensitivity of results at each iteration, in this case for Iteration 1
- Select GSA/Sobol in the new window.
- From Responses select acceleration.
- The user has the choice to Sort the plot by selecting the checkbox in the setup menu (default).
- To compare multiple plots for sensitivities of the input variables on the various responses, the user can select the split option at the task bar and repeat the previous steps.
- The viewer allows the user to select multiple responses for sensitivity analysis to get the influence of the variables on e.g. the whole problem or a load case using the following steps:
- Create a new plot area similar to step 5. Then select the option Multi.
- Select the necessary responses, in this case all the responses are selected .
- The plot describes the cumulative plot on a single graph w.r.t. the variables. This is only availabe for GSA, not for ANOVA, since GSA values are normalized.


