Convergence
Home Screen Process Flowchart
- The results can be viewed by selecting the view button on the task bar. A seperate window of LS-OPT Viewer opens up.
LS-OPT Viewer
- Choose History under the category Optimization.
Input Variables
Select Variables → Emboss_Depth
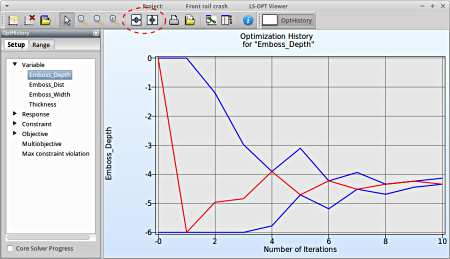
Fig. 1(a) shows:
- The optimization history of the variable Emboss_Depth.
- The development of the variable value of the optimum (red line)
- How the range of Emboss_Depth (set from -6 to 0 at the beginning) decreases after every iteration (blue lines).
- This variable is important (see Sensitivities) to reach the bounds of the constraint and minimize the objective and seems to be converged.
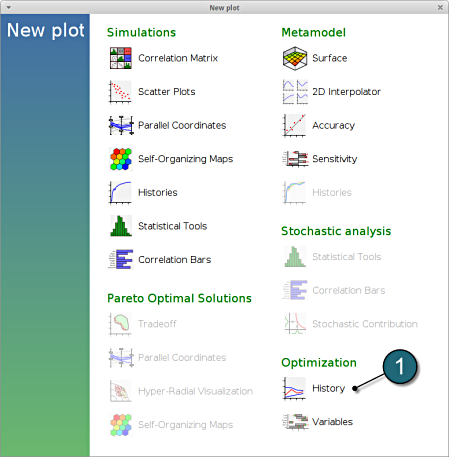
Fig. 1(a)
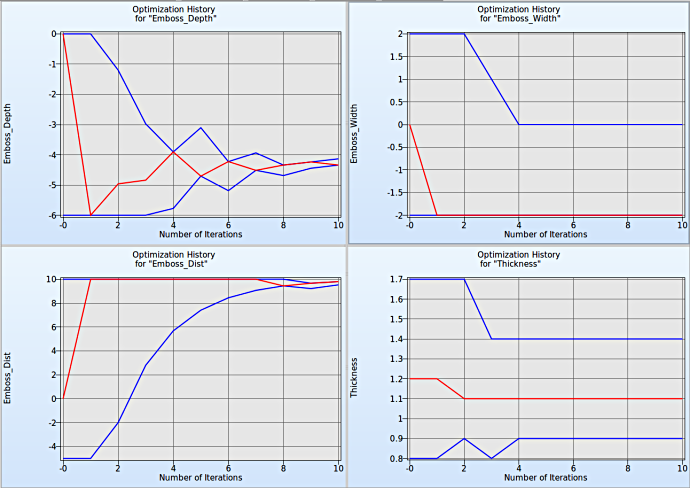
To compare multiple plots for covergence behaviour of the input variables, the user can select the split option at the task bar and select the other variables.
Fig. 1(b) Input variables convergence behaviour
It is evident from Fig. 1(b) that the input variables Emboss_Depth and Emboss_Dist have good convergence behaviour whereas Emboss_Width and Thickness do not tend to converge beyond a certain point even with additional iterations.
Constraints
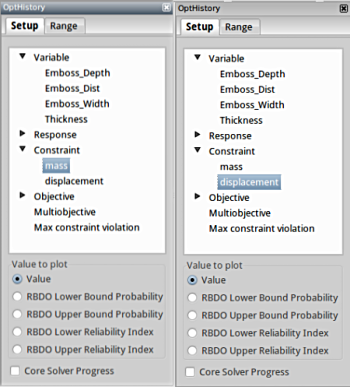
Select Constraints → mass
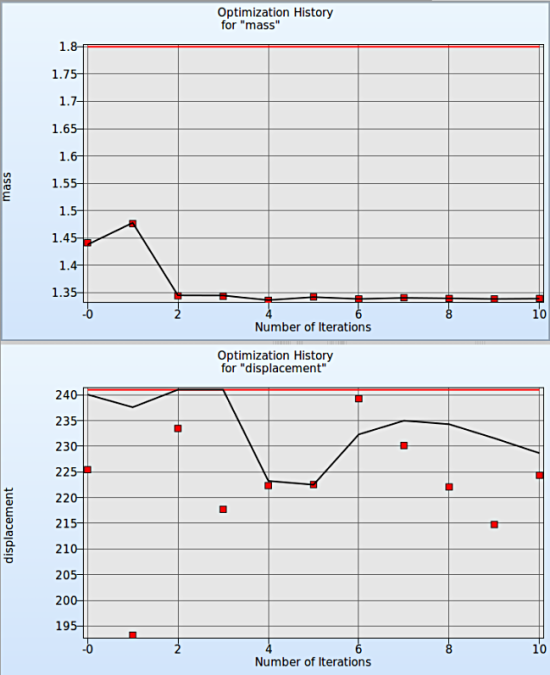
- Following similar steps, the user can view the Optimization history for the constraints of optimization, in this case for mass.
- To compare multiple plots for contraints, the user can select the split option at the task bar and select the other constraint.
Fig. 2 shows :
- The predicted result (black line) of the optimal constraints for every iteration.
- The computed result (red points) of the constraints for every iteration.
- The constraints upper bound (red line).
Fig. 2 Optimization History for Constraints
Objective
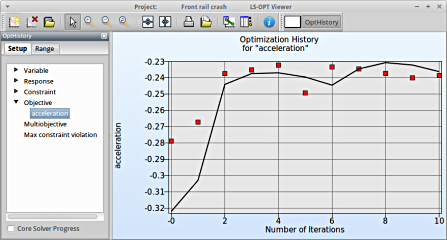
In the similar way the user can check the convergence of the main objective of the optimization.
Select Objective → acceleration
- The predicted result (black line) of the optimal objective acceleration for every iteration.
- The computed result (red points) of the optimal objective acceleration for every iteration.
- The convergence trend of the acceleration objective.

