Accuracy
What is the approximation error of the result?
The approximation error indicators (predict the metamodel accuracy of the results) can be visualized in the LS-OPT Viewer.
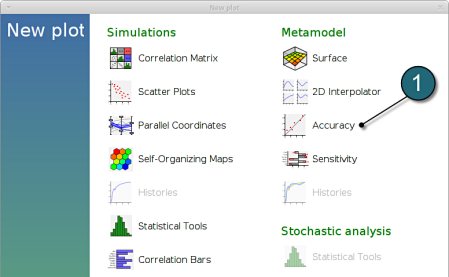
New Plot
- To view a new plot select the plot button on the task bar. A seperate window of LS-OPT Viewer opens up.
LS-OPT Viewer
- Select under Metamodel the item Accuracy
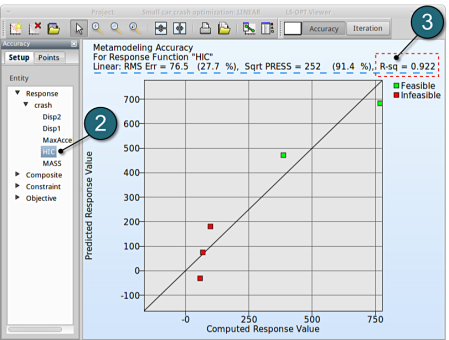
- From Entity select Responses → HIC.
- We can find RMS Error and R2 (R-sq) above the plot.
→ Despite the coefficient of determination (R2) being high (=0.922), the RMS Error may need further improvement, e.g. more iterations or selection of a more suitable metamodel (e.g. Feedforward Neural Network or Radial Basis Function Network). Nevertheless for a raw estimate the result may be considered as acceptable.
→ It is important to note that the metamodel performs poor in cross-validation test using the SPRESS method. A relatively high SPRESS value (=91.4%) justifies a low confidence and a low predictive capability of the fitted metamodel.
- With the same procedure you may find the RMS Error, R² and SPRESS Residual of the other responses:
|
|
Mean Response Value |
RMS Error |
R2 |
SPRESS Residual |
|
MASS |
0.7742 |
0 |
1 |
0 (0%) |
|
Disp1 |
-159.3827 |
2.0309 (1.27%) |
0.4783 |
6.68 (4.19%) |
|
Disp2 |
-694.5841 |
5.5486 (0.80%) |
0.9896 |
18.2 (2.62%) |
|
HIC |
275.726 |
76.5620 (27.74%) |
0.9225 |
252.11 (91.43%) |


