Sensitivities
Which variable appears to be the most important?
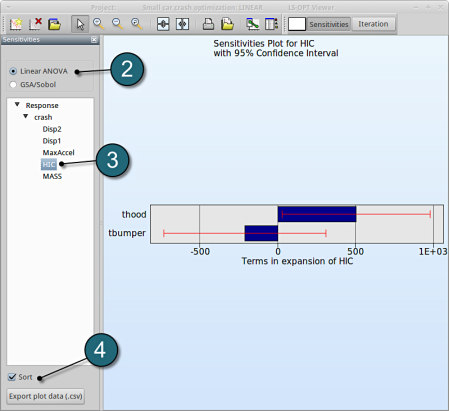
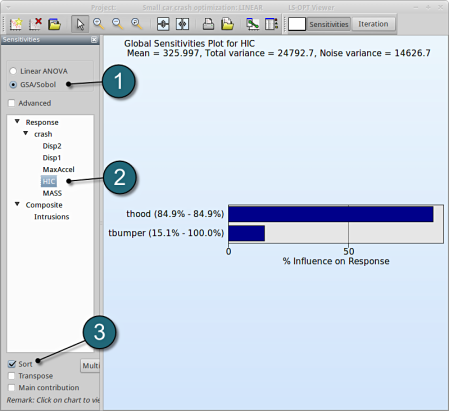
The significance of a variable for a response can be illustrated with ANOVA (analysis of variance) or GSA/Sobol (global sensitivity analysis), e.g for the response HIC you may find:
New Plot
- To view a new plot select the plot button on the task bar. A seperate window of LS-OPT Viewer opens up.
LS-OPT Viewer
ANOVA
- Select under Metamodel select the item Sensitivity
- Select Linear ANOVA in the new window.
- From Response select HIC.
- Sort the variables according to their significance for HIC.
- Select GSA/Sobol.
- From Response select HIC.
- Sort the variables according to their significance for HIC.
→ We come to the same conclusion by using GSA. The influence of thood on HIC is 84.9%, larger than that of tbumper (15.1%).
GSA is a non-linear sensitivity measure, but evaluated on the metamodel, which is linear here. Hence it should lead to the same ranking than ANOVA.


