Sensitivities
Which variable appears to be the most important?
The significance of a variable for a response can be illustrated with ANOVA (analysis of variance) or GSA/Sobol (global sensitivity analysis). In this case, only GSA is available, since ANOVA is only calculated for responses, not for composites.
New Plot
- To view a new plot select the plot button on the task bar. A seperate window of LS-OPT Viewer opens up.
LS-OPT Viewer
GSA/Sobol
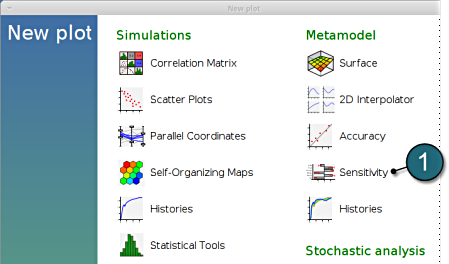
- Restart the LS-OPT Viewer and select under Metamodel the item Sensitivity
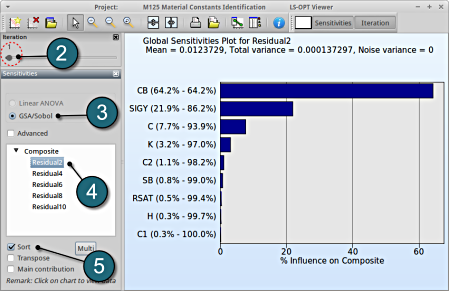
- We can slide to observe the sensitivity of results at each iteration. In this case for Iteration 1.
- The linear ANOVA measure is unavailable. Choice can be kept at GSA/Sobol.
- Select any of the Composite to observe the sensitivity measure. In this case select Residual2.
- Select Sort for the variables.
→ For the composite Residual2 the variable CB is the most important or significant, followed by the variable SIGY.
→ Similar observation can be made for the other composites upon selection.
Multiple Responses Sensitivity
The viewer allows the user to select multiple responses and composites for sensitivity analysis to get the influence of the variables on e.g. the whole problem or a load case using the following steps:
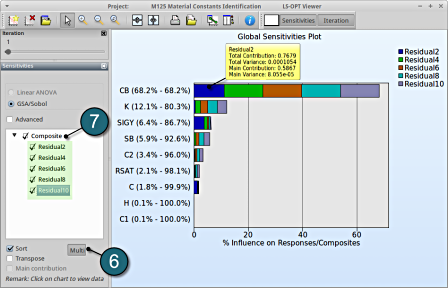
- Select the Multi option.
- Select the desired entities, in this case all the composites are selected .
- The plot describes the cumulative values on a single graph w.r.t. the variables. This is only availabe for GSA, since the values are normalized.


