Accuracy
What is the approximation error of the result?
The approximation error indicators (predict the metamodel accuracy of the results) can be visualized in the LS-OPT Viewer.
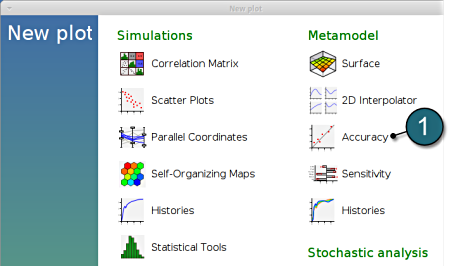
New Plot
- To view a new plot select the plot button on the task bar. A seperate window of LS-OPT Viewer opens up.
LS-OPT Viewer
- Select under Metamodel the item Accuracy.
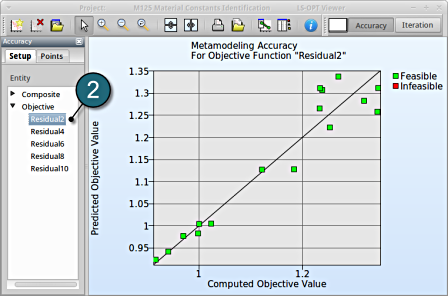
- From Entity select the Objective Residual2.
→ Good approximation: low distance between black line and green points.
→Similar observations can be made by selecting the other objectives.
Optimization History
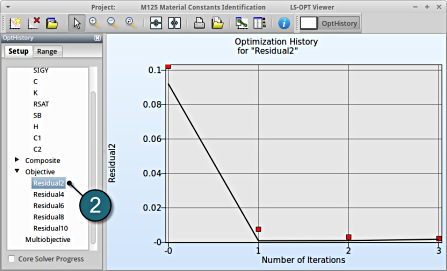
- Alternatively the accuracy of the optimal values at various iterations can be studied under a Optimization History plot.
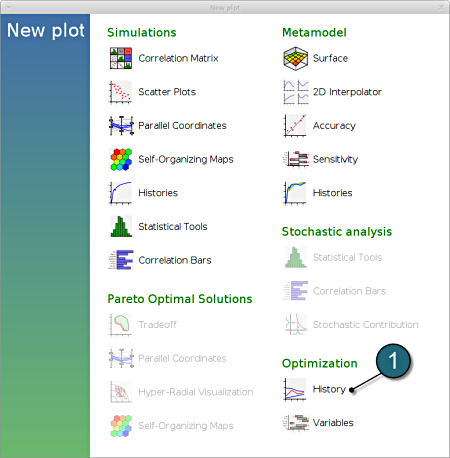
New Plot
- To view a new plot select the plot button on the task bar. A seperate window of LS-OPT Viewer opens up.
LS-OPT Viewer
- Select under Optimization the item History.
- From Setup tab, select the Objective Residual2.
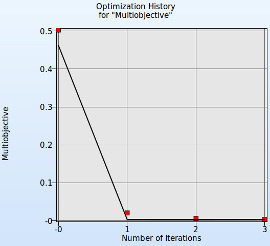
→ Good approximation of optima: The computed values (red points) almost coincide with the predicted values (black line) for the optimum.
→Similar observations can be made by selecting the other objectives.
→For observing the multiobjective select the option.

