Convergence
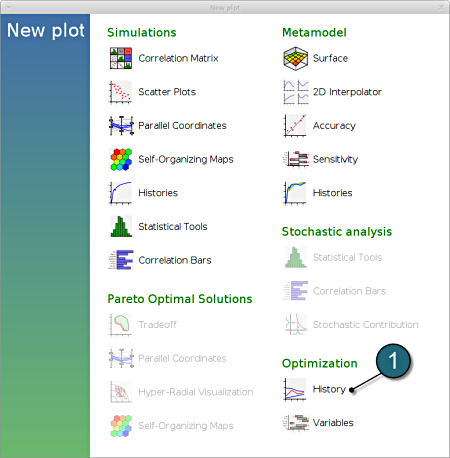
New Plot
- To view a new plot select the plot button on the task bar. A seperate window of LS-OPT Viewer opens up.
LS-OPT Viewer
- Choose History under the category Optimization.
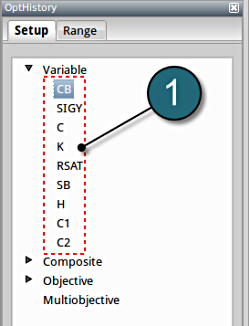
We can choose from the left side the entities we want to observe.
Convergence of Input variables
Setup
- Select the input variable to observe the convergene behaviour across the iterations.
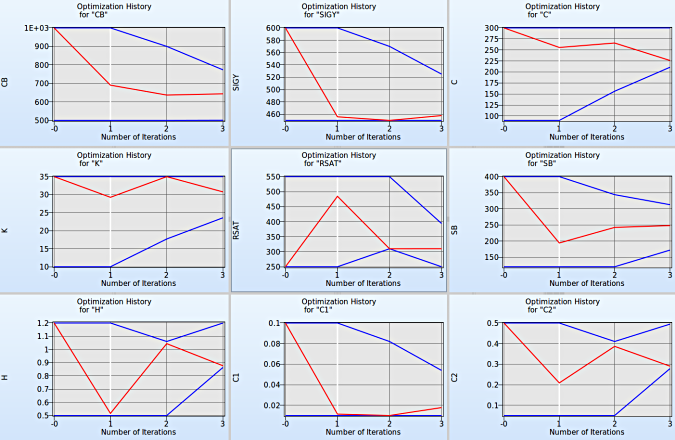
Use the split plot from the task menu to compare the various Optimization Histories of the input variables. Interesting revelations can be made from the plots. (Shown in figure below)
Fig. Convergence behaviour of all input variables.
Convergence of Objectives
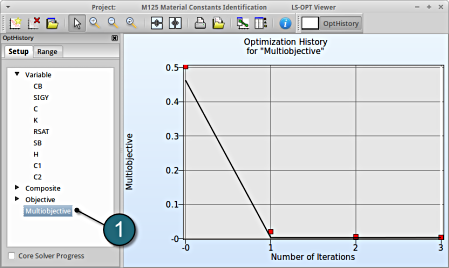
1. Select Objective → Multiobjective
- The predicted result (black line) of the optimal objective Multiobjective for every iteration.
- The computed result (red points) of the optimal objective Multiobjective for every iteration.
- The convergence trend of the Multiobjective.


