Histories
Home Screen Process Flowchart
- The results can be viewed by selecting the view button on the task bar. A seperate window of LS-OPT Viewer opens up.
LS-OPT Viewer
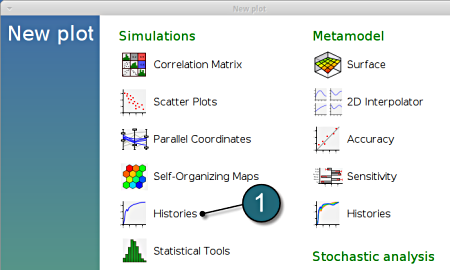
- Select under Simulations the item Histories.
Plot Setup
Setup the plot for pct2
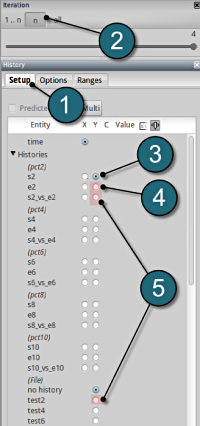
- Select the Setup tab.
- Select n for the iterations setup.
- Plot co-ordinate selections :
x axis : time
y axis : s2
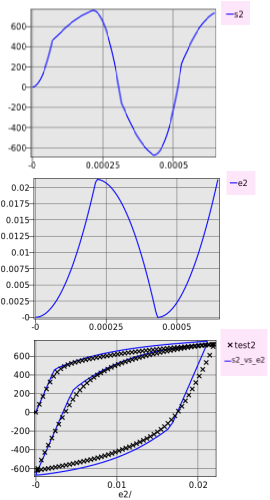
- The first plot in the image depicts a plot of the stress against time.
- In the similar way plot the strain curve by changing the y axis entity to e2.
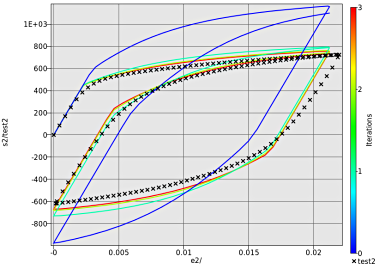
- The loading cycle curve can be illustrated using the choice for the y axis as s2_vs_e2 and test2. We can notice the hysteresis for the cyclic loading case.
Multiple Plots
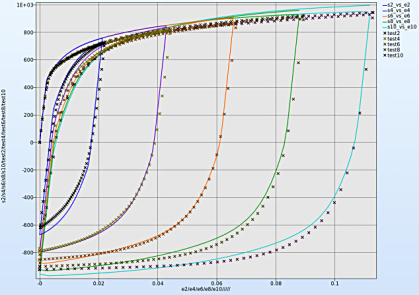
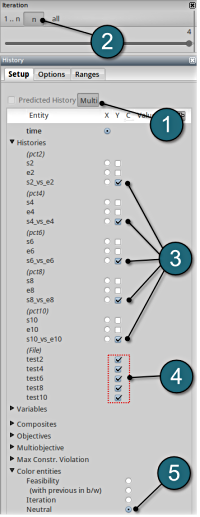
- Select the Multi option to view all the simulation crossplots and test curves simultaneously.
- Select n for the iterations setup and select the last iteration to display the optimal curves.
- To view all the stress-strain crossplots viz. s2_vs_e2, s4_vs_e4, etc. select the respective boxes.
- Similarly select all the test curves viz. test2, test4, etc.
- To distinguish between the crossplots it's convinient to select the Neutral option for the Color entities.
Convergence
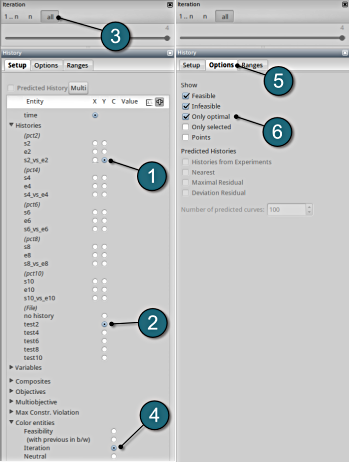
- Select any of the history curves. In this case s2_vs_e2 plot has been selected.
- From the file histories select the corresponding test curve, e.g. test2.
- To observe the convergence over the iterations choice is made for all the iterations.
- To distinguish between the iterations choice of Color entities is made on the Iterations.
- Select the Options tab.
- To show the optimal curves over the iterations the Only optimal option has been selected.
