Results
Parallel Coordinate Plot (PCP)
The parallel coordinate plot shows all entities of a design by a line such that any number of entities can be simultaneously shown. The user can move the sliders on each entity to filter-out the undesired values and screen the objectives.
Start the LS-OPT Viewer (by selecting the Viewer panel in the LS-OPT GUI)
- Select Parallel Coordinates under subtitle "Simulations".
Find the HIC value of the design with the smallest intrusion.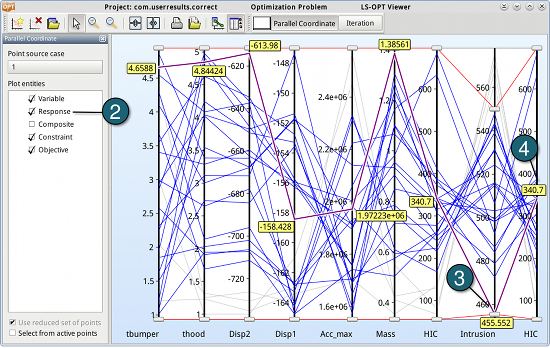
- Check the box of Response in Plot entities to show all the responses in the PCP. Be sure that the Constraint (Intrusion) and the Objective (HIC) are also selected.
- Push the slider of Intrusion slowly upwards, until the first reached blue line turns grey. Slightly pull back the slider to make the line visible (i.e. blue) again and click on the line. The smallest intrusion among all the designs is 455.552.
- We can find the HIC value of the design with smallest intrusion is 340.7.
Find the HIC and Intrusion values for the design with the lowest Max. Acceleration.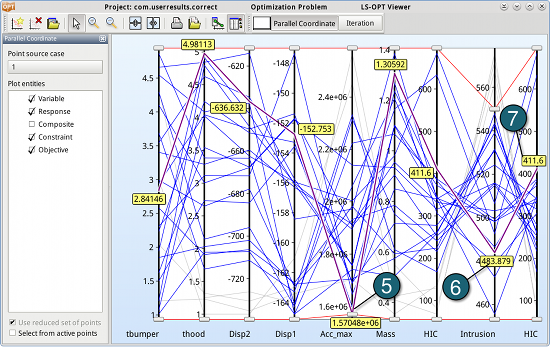
- Repeat step 3 on the response Acc_max and find the lowest value of Max. Acceleration is 1.57048x10⁶.
- The Intrusion value for the design with the lowest Max. Acceleration is 483.879.
- The HIC value for the design with the lowest Max. Acceleration is 411.6.