View
View
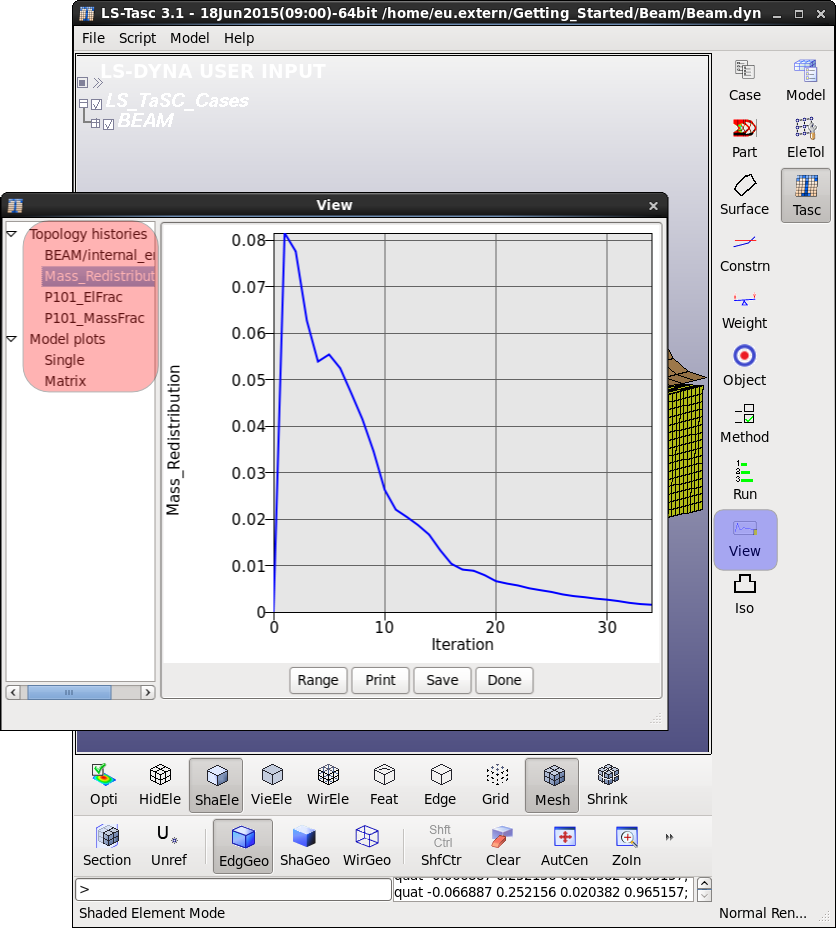
The view panel is similar to a postprocessor. Various topology histories plots such as change in mass fraction, element fraction, constraint values etc over the iterations are displayed in this panel. The model plots options are used to view d3plot data of iterations.


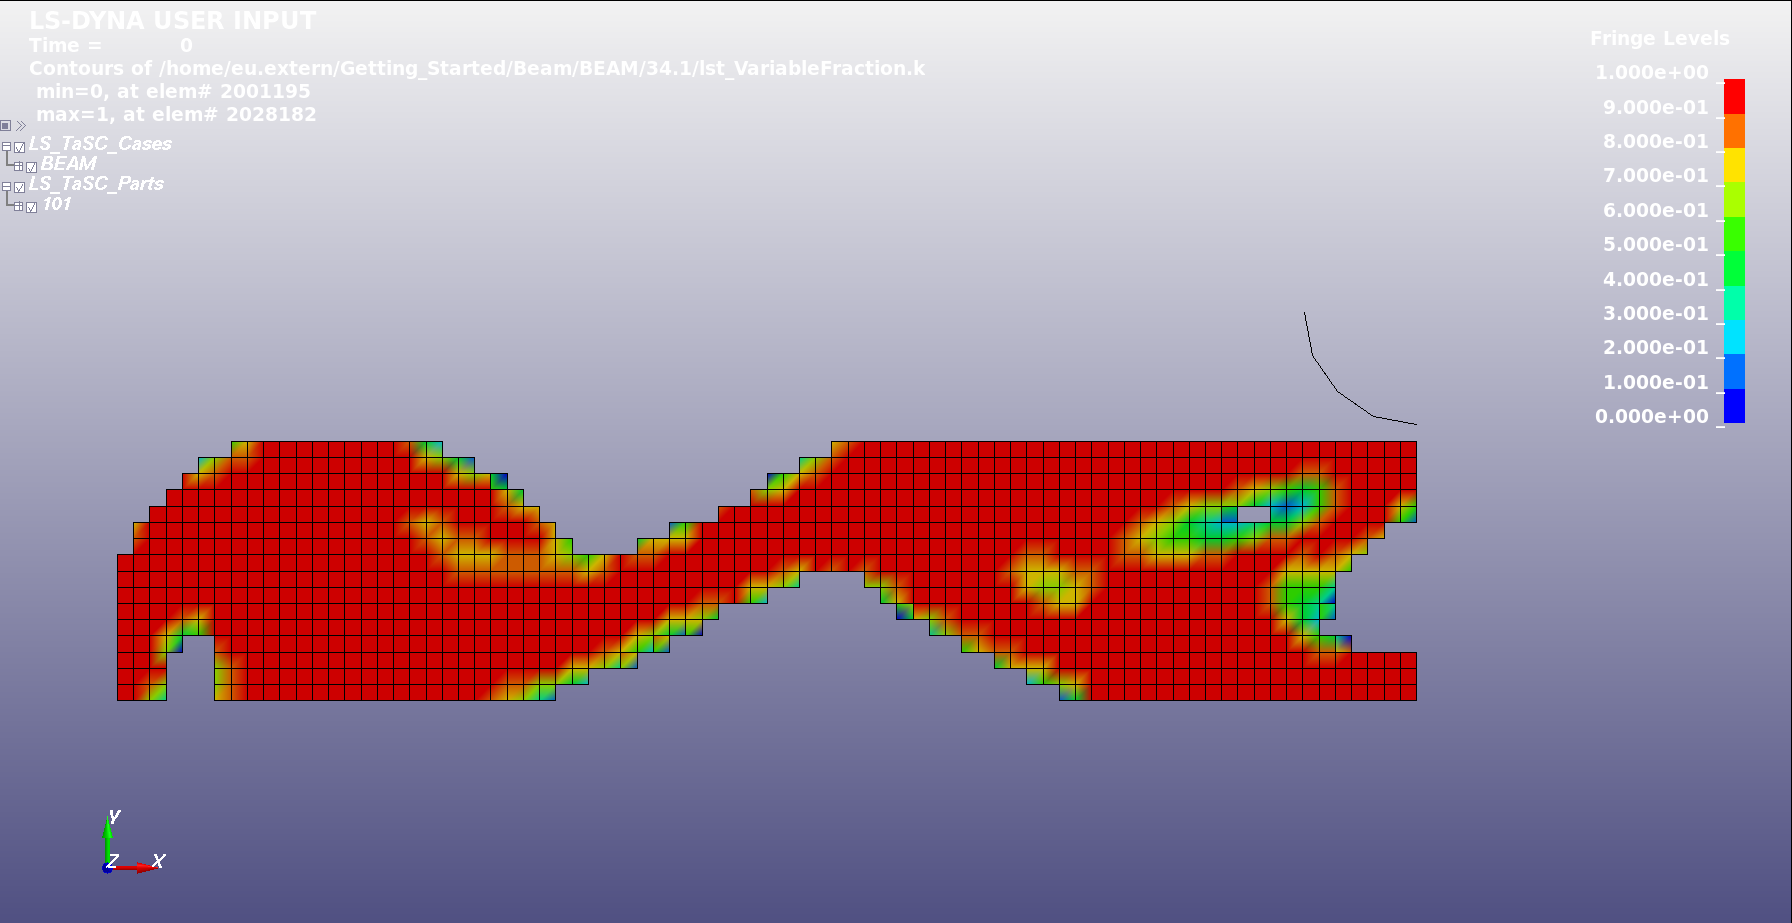
Figure 01: Final topology

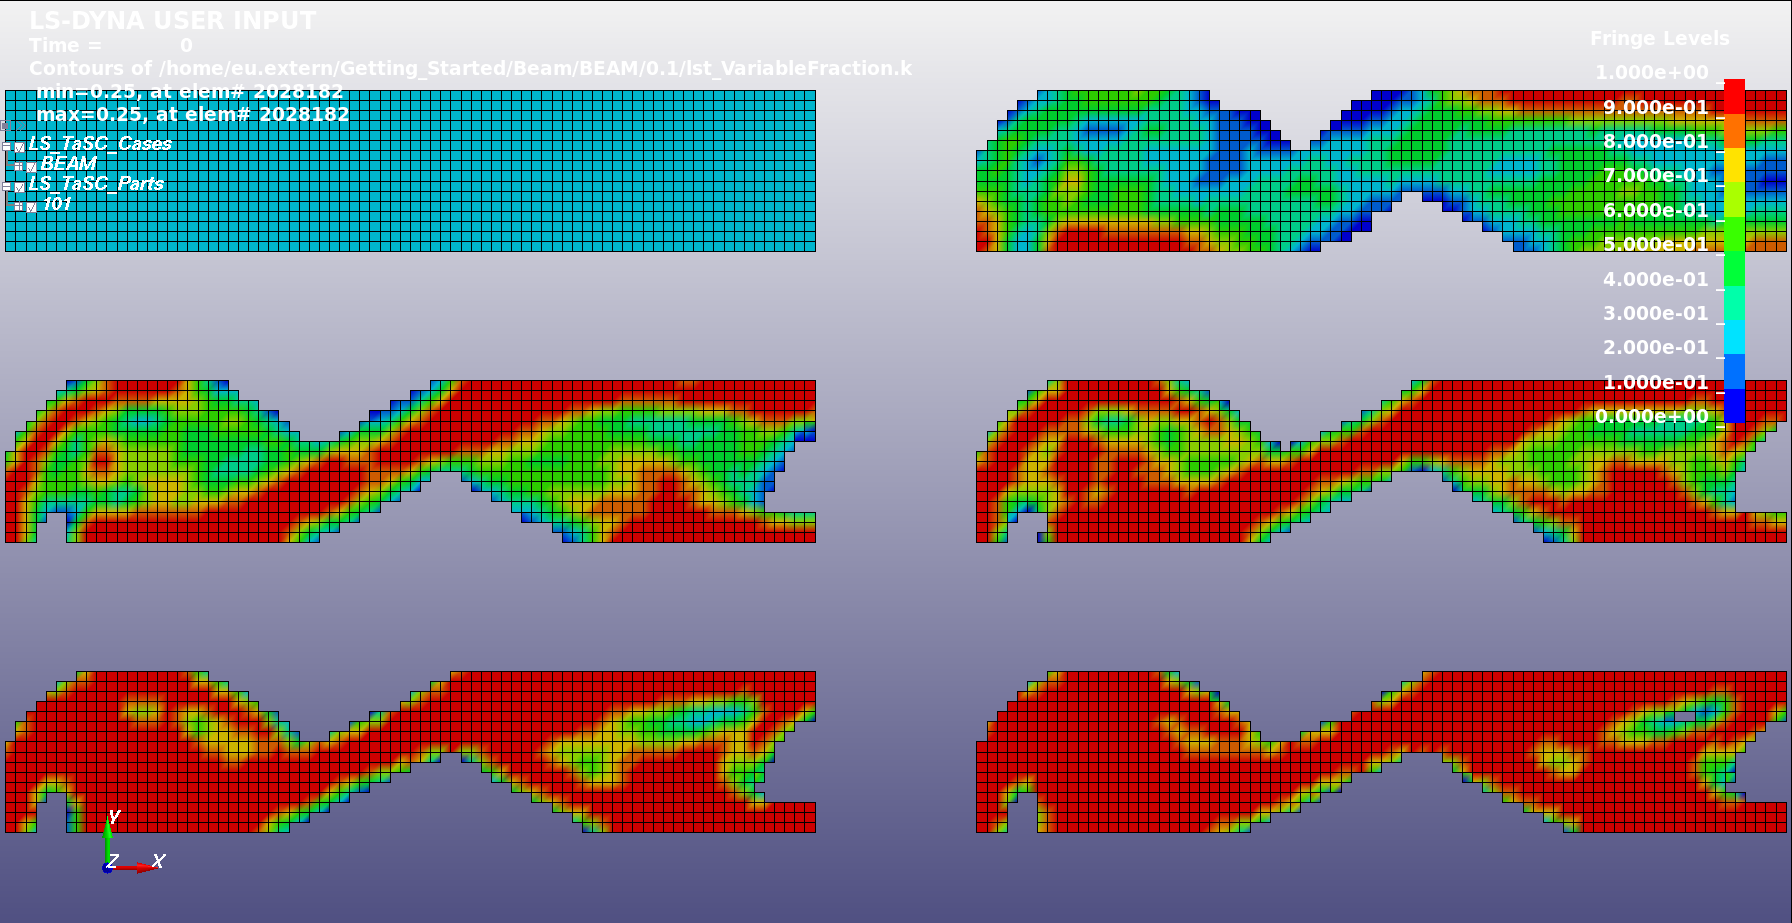
Figure 02: The topologies at different iterations
